Generic 10: Animal reservoir zoonosis
Zoonosis represents a list of diseases that transmit from animals to humans. They are of particular interest because typically a zoonosis disease has previously not been in the population, and the whole population is susceptible. This tutorial demonstrates an animal reservoir, independently of human infections, reintroducing zoonotic cases at a specified rate.
This tutorial is important because for many zoonotic diseases, there is a background animal reservoir that continuously exposes humans to infection. In these situations, the interest is not only in a single large outbreak which can be simulated by an Outbreak event, but also in the population-level dynamics where there is a continuous background rate of introducing a new zoonotic infection to the human population which can be configured by parameter Zoonosis_Rate.
In this tutorial, the rate of infection from the animal reservoir can be adjusted with respect to the human-to-human infectiousness to vary along a spectrum, from a low rate of primary zoonotic infection with substantial secondary human transmission to a high zoonosis rate with low human transmission. This shifts the fraction of cases that are primary zoonotic infections. By varying the parameter Zoonosis_Rate, you can observe the daily rate of zoonotic infection per individual and the impact of the parameter changes on the outbreak.
Input files
The input files for this tutorial differ from the previous tutorials. The previous tutorials were simple single-node simulations without migration. This tutorial uses Seattle as an example of a multi-node simulation with migration rates. The input files include not a only a human population demographics file but also a zoonosis demographics file and local and regional migration files.
- Seattle_30arcsec_demographics_zoonosis
- Seattle_Seattle_30arcsec_local_migration
- Seattle_Seattle_30arcsec_regional_migration
You can view these files at <path_to_directory>RegressionScenariosInputFiles where <path_to_directory> is the location where EMOD source files were installed. For more information on data input files, see Input data files.
Key configuration parameters
This tutorial uses the config.json file in the <path_to_directory>RegressionScenariosGeneric10_Zoonosis directory.
Input file parameters
This tutorial uses two demographics files. The first demographics file provides information about the people in the region while the second provides information on zoonosis. Multiple demographics file are listed under one parameter. When there is more than one demographics file, the file names are separated by a semi-colon.
This is a multi-node simulation that also supports migration between the nodes. This simulation supports only local and regional migration. The input files for the different types of migration are specified with different parameters.
The following parameters specify the demographic and migration input files. For more information, see Input data files parameters.
Set the following parameters:
- Set Demographics_Filename to “Seattle_30arcsec_demographics.json;Seattle_30arcsec_demographics_zoonosis.json.”
- Set Local_Migration__Filename to “Seattle_30arcsec_local_migration.bin.”
- Set Regional_Migration_Filename to “Seattle_30arcsec_regional_migration.bin.”
Population dynamics parameters
The following parameters enable vital dynamics for birth but disable non-disease related death and disease related deaths. For more information, see Population dynamics parameters.
Set the following parameters:
- Set Enable_Vital_Dynamics to 1.
- Set Enable_Birth to 1.
- Set Death_Rate_Dependence to “NONDISEASE_MORTALITY_BY_AGE_AND_GENDER.”
- Set Enable_Disease_Mortality to 0.
Migration input file parameters
The following parameters enable or disable the specific type of migration. For more information, see Migration parameters.
Set the following parameters:
- Set Enable_Air_Migration to 0.
- Set Enable_Local_Migration to 1.
- Set Enable_Regional_Migration to 1.
- Set Enable_Sea_Migration to 0.
SEIRS model setup parameters
This tutorial uses an SEIRS model. The following parameters configure the EMOD executable to run an SEIRS-like disease model with person-to-person direct transmission. For more information, see Incubation and Enable or disable features parameters.
Set the following parameters:
- Set Base_Incubation_Period to 3.
- Set Incubation_Period_Distribution to “FIXED_DURATION.”
- Set Enable_Immunity to 1.
- Set Enable_Immune_Decay to 1.
Migration parameters
In a multi-node simulation with migration enabled, individuals have a probably of “migrating” to another node at every time step unless they have already migrated. When an individual has migrated to another node, they can shed or acquire infection in that node.
The migration pattern for this simulation is configured as “WAYPOINTS_HOME” with Roundtrip_Waypoints set to 1. This means, individuals “migrate” one day and return home the next day. There are no intermediate nodes between the home and the destination node. For more information, see Migration parameters.
Set the following parameters:
- Set Migration_Model to “FIXED_RATE_MIGRATION.”
- Set Migration_Pattern to “WAYPOINTS_HOME.”
- Set Roundtrip_Waypoints to 1.
Disease parameters
These parameters configure the EMOD executable to run an SEIRS-like disease model with person- to- person direct transmission. For more information, see Infectivity and transmission parameters.
Set the following parameters:
- Set Base_Infectivity to 0.25.
- Set Base_Infectious_Period to 7.
- Set Infectious_Period_Distribution to “FIXED_DURATION.”
Zoonosis parameters
The following parameters configure the animal zoonosis. The Zoonosis_Rate is multiplied with the Zoonosis rate in the demographic file. For more information, see General disease parameters.
Set the following parameters:
- Set Animal_Reservoir_Type to “ZOONOSIS_FROM_DEMOGRAPHICS.”
- Set Zoonosis_Rate to 0.005.
Immunity parameters
At the time of recovery when the infection is cleared, the values of immunity against acquisition, transmission, and mortality are multiplied by Immunity_Acquisition_Factor, Immunity_Transmission_Factor, and Immunity_Mortality_Factor parameters. The default values are set to 0 in the files, which means full and complete protection against each. For more information, see Immunity parameters.
In this scenario, people’s immunity decays with an average half-life of 33 days and a 400-day offset. This assumption applies to transmission blocking, acquisition blocking, and mortality blocking immunity.
Set the following parameters:
- Set Acquisition_Blocking_Immunity_Duration_Before_Decay to 400.
- Set Acquisition_Blocking_Immunity_Decay_Rate to 0.03.
- Set Transmission_Blocking_Immunity_Duration_Before_Decay to 400.
- Set Transmission_Blocking_Immunity_Decay_Rate to 0.03.
- Set Immunity_Acquisition_Factor to 0.
- Set Immunity_Mortality_Factor to 0.
- Set Immunity_Transmission_Factor to 0.
- Set Mortality_Blocking_Immunity_Duration_Before_Decay to 400.
- Set Mortality_Blocking_Immunity_Decay_Rate to 0.03.
Intervention
This simulation uses an Outbreak intervention for repeated infection seeding. This simulation uses the campaign.json in the <path_to_directory>RegressionScenariosGeneric10_Zoonosis directory. For more information, see Outbreak parameters.
{
    "Use_Defaults": 1,
    "Campaign_Name": "Generic Seattle Regression Campaign",
    "Events": [{
        "Event_Coordinator_Config": {
            "Intervention_Config": {
                "Antigen": 0,
                "Genome": 0,
                "Outbreak_Source": "ImportCases",
                "class": "Outbreak"
            },
            "Number_Distributions": 10,
            "Target_Demographic": "Everyone",
            "class": "StandardInterventionDistributionEventCoordinator"
        },
        "Nodeset_Config": {
            "Polygon_Format": "SHAPE",
            "Vertices": "-122.320726936496,47.6597902588541 -122.320406460197,47.6520988276782 -122.308388598985,47.6471314450438 -122.301658596706,47.6541819236217 -122.315118601264,47.6644371651896 -122.320726936496,47.6597902588541",
            "class": "NodeSetPolygon"
        },
        "Start_Day": 40,
        "class": "CampaignEvent"
    }]
}
Run the simulation
Run the simulation and generate graphs of the simulation output. For more information, see Run simulations.
Note
Because the EMOD model is stochastic, your graphs may appear slightly different from those given below.
Simulation output graphs
After the initial outbreak, there are no additional imported cases set in the campaign file. However, because of the non-zero zoonosis rate, there are several introductions of infections in the background, as shown in the Log Prevalence chart in Figure 1.
When enough susceptible individuals are accumulated due to immunity waning, one of the seeds starts a disease outbreak later due to zoonosis (see Figure 1 and Figure 2). The seeding and occasional outbreaks after the seeding is shown in the following graph plotting infections over time.
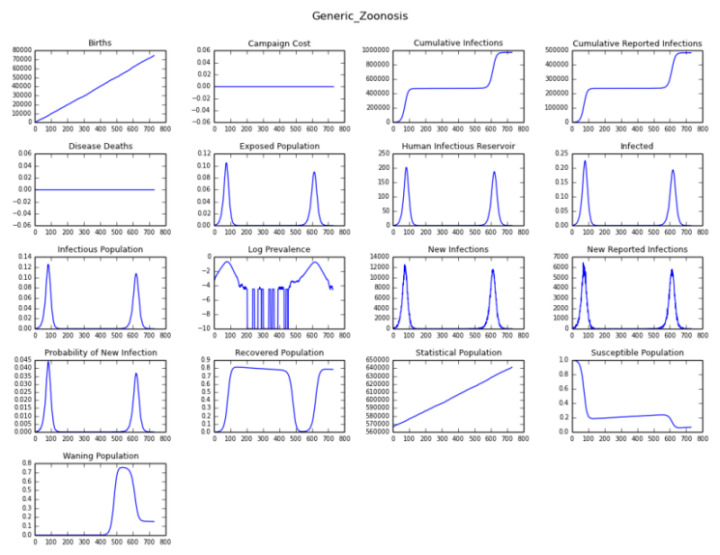
Figure 1: Animal reservoir zoonosis charts
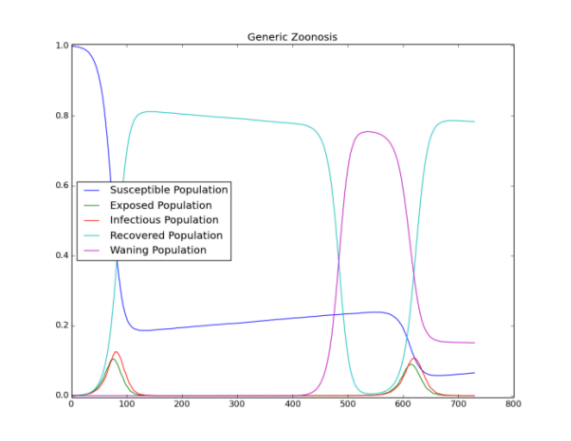
Figure 2: Re-seeding of infections cased by zoonosis and waning immunity
Exploring the model
Change the Zoonosis_Rate in the configuration file to see the changing frequency of outbreaks.