HINT 2: School closure
This tutorial replicates disease transmission dynamics through the different activities of individuals. In this tutorial, a group is defined by the place where individuals go for similar activities but it is not tied to one specific geographic location. For example, “school” represents all of the students that are going to school instead of having a group for every school that the students attend. As another example, “community” represents places that people meet for varying activities outside of school and work, such as shopping, getting gas, or going to a movie.
This tutorial also shows the effect of disease-control policies that modify group mixing during a disease outbreak (for example, the effect of closing schools during a hypothetical pandemic). Students are transitioned from the school group to another group during school closure, and reverted back to the school group when the school is reopened. There are two distinct groups that represent the different activities of school-age children during a school closure:
- Children who mostly stay at home and the contact rates were largely reduced.
- Children who spend more time outside of home and have more contacts with other groups
Contents
Demographics inputs
You can view the complete “hint_schoolclosure_demographics” file at <path_to_directory>RegressionScenariosInputFiles where <path_to_directory> is the location where EMOD source files were installed.
IndividualProperties
Property and values
The Property and Values members of IndividualProperties define five groups. There are three groups that represent the places where individuals normally go when schools are open. There are two groups that represent the place where students go during a school closure. For more information, see NodeProperties and IndividualProperties parameters.
Normal activity groups:
- School
- Students who are in school.
- Work
- People who are working outside of the home.
- Community
- General activities for people who neither work nor go to school.
School closure groups:
- SchoolBreak_Interaction
- Students who do activities outside of the home during a school break.
- SchoolBreak_NonInteraction
- Students who mostly stay at home during a school break.
Initial_Distribution
At the beginning of the simulation, every individual has a 10% chance of being assigned to “Community”, 30% chance to “School”, and 60% chance to “Work” as specified by the Initial_Distribution array. Individuals are not assigned to SchoolBreak_Interaction and SchoolBreak_NonInteraction at the beginning of the simulation.
Transitions
Transitions is used to move individuals from one property value (group) to another. All of the individuals in “School” are moved to SchoolBreak_NonInteraction on day 20 and moved back to “School” 20 days later (day 40). For more information, see Transitions.
SchoolBreak_Interaction is not used in this tutorial. It is added to the demographics file so that you can easily run some variations of this simulation.
TransmissionMatrix
TransmissionMatrix contains the  values of the WAIFW matrix. The
transmission Route is “Contact”. The values are added to Matrix.
values of the WAIFW matrix. The
transmission Route is “Contact”. The values are added to Matrix.
The first three rows and columns of Matrix demonstrate a hypothetical transmission rate between the three groups: “Community”, “School”, and “Work”. Students are a main driver of disease transmission. The last two columns and rows demonstrate the different behaviors when students are not in school. Note that the fourth column and row for SchoolBreak_Interaction have a much higher transition rate than SchoolBreak_NonInteraction in the fifth row and column.
{
    "Defaults": {
        "IndividualProperties": [{
            "Property": "Place",
            "Values": ["Community", "School", "Work",
                "SchoolBreak_Interaction", "SchoolBreak_NonInteraction"
            ],
            "Initial_Distribution": [0.1, 0.3, 0.6, 0.0, 0.0],
            "Transitions": [{
                "From": "School",
                "To": "SchoolBreak_NonInteraction",
                "Type": "At_Timestep",
                "Coverage": 1,
                "Timestep_Restriction": {
                    "Start": 20
                },
                "Age_In_Years_Restriction": {},
                "Probability_Per_Timestep": 1,
                "Timesteps_Until_Reversion": 20
            }],
            "TransmissionMatrix": {
                "Route": "Contact",
                "Matrix": [
                    [0.5, 0.5, 0.5, 1, 0.1],
                    [0.5, 3, 1.5, 0.0, 0.0],
                    [0.5, 1.5, 1, 1, 0.1],
                    [1, 0.0, 1, 1, 0],
                    [0.1, 0.0, 0.1, 0, 0.1]
                ]
            }
        }]
    }
}
Key configuration parameters
The simulation simulates the person-person disease transmission of influenza-like-illness model (SEIR) in a hypothetical community over a short period. For more information, see Infectivity and transmission and Incubation parameters. You can view the config.json file in the ScenariosHINT02_SchoolClosure directory.
Set the following parameters:
- Set Base_Infectivity to 1.
- Set Base_Infectious_Period to 1.8.
- Set Base_Incubation_Period to 1.
- Set Enable_Heterogeneous_Intranode_Transmission to 1.
- Set Incubation_Period_Distribution to “EXPONENTIAL_DURATION.”
- Set Infectious_Period_Distribution to “EXPONENTIAL_DURATION.”
Interventions
An OutbreakIndividual event seeds the initial infection on day 1 of the simulation. For more information, see OutbreakIndividual parameters.
You can view the campaign.json file in the in the ScenariosHINT02_SchoolClosure directory.
{
    "Use_Defaults": 1,
    "Events": [
        {
            "Start_Day": 1,
            "Nodeset_Config": {
                "class": "NodeSetAll"
            },
            "Event_Coordinator_Config": {
                "Number_Distributions": -1,
                "Intervention_Config": {
                    "Antigen": 0,
                    "Genome": 0,
                    "outbreak_source": "PrevalenceIncrease",
                    "class": "OutbreakIndividual"
                },
                "Demographic_Coverage": 0.001,
                "Target_Demographic": "Everyone",
                "class": "StandardInterventionDistributionEventCoordinator"
            },
            "class": "CampaignEvent"
        }
    ]
}
Run the simulation
Run the simulation and generate graphs of the simulation output. For more information, see Run simulations.
Note
Because the EMOD model is stochastic, your graphs may appear slightly different from those given below.
Expected simulation output
The output shows the effect of school break under the assumption that students will reduce their contact during the break (SchoolBreak_NonInteraction).
The following graph shows the daily number of infected people for each group in the simulation. It is clear that since students are the major driver of transmission, and the fact that students do not interact much with other groups during the break, the school break was able to delay the epidemic for 20 days.
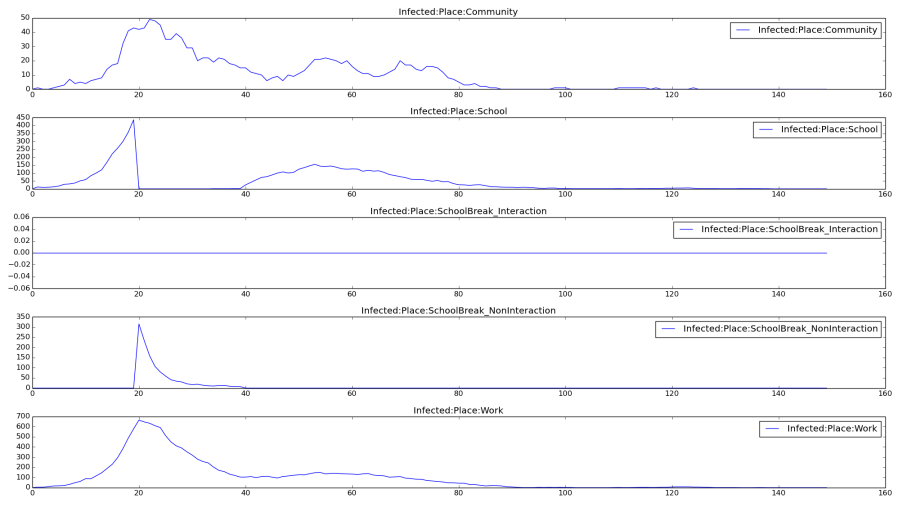
Figure 1: School closure - SchoolBreak_NonInteraction
Exploring the model
Change the transition in intervention to SchoolBreak_Interaction. In this case, students will interact more with other groups, therefore, it is expected that a school break does not necessarily slow down the epidemic.