HINT 3: Age and accessibility
This tutorial illustrates the effect of heterogeneity in both mixing between population groups and in access to interventions, specifically vaccination. The scenarios simulate a measles outbreak over a single year in an initially fully susceptible population, highlighting differences in age and accessibility group-specific disease dynamics.
It consists of three scenarios that illustrate the measles outbreak and targeted vaccination campaigns:
- A measles outbreak with no interventions. The supporting configuration and campaign files are in ScenariosHINT03_AgeAndAccessA_BaselineOutbreak.
- An age-targeted outreach vaccination campaign for 6 to 10 year olds. The outreach is designed to reach populations who are normally inaccessible. The supporting configuration and campaign files are in ScenariosHINT03_AgeAndAccessB_AgeTargetedVaccine.
- A mass measles vaccination campaign of the entire population. This is a standard campaign, not an outreach campaign, as it targets individuals who are in the accessible group of the population and easily reached by the vaccination campaign. The supporting configuration and campaign files are in ScenariosHINT03_AgeAndAccessC_AccessTargetedVaccine.
Note
The fully susceptible population in this tutorial is used to illustrate the model features in the most parsimonious manner. For calibration to real data, you would need to initialize a distribution of immunity in the population at the beginning of the epidemic to represent past history of infection and vaccination. This could be done through matching serology data and/or matching vaccination dose history.
This tutorial assumes that you have read the previous HINT tutorial, HINT 2: School closure.
Contents
Demographics inputs
You can view the complete hint_ageandaccess_demographics and hint_ageandaccess_overlay files at <path_to_directory>RegressionScenariosInputFiles where <path_to_directory> is the location where EMOD source files were installed. For more information, see Demographics parameters.
IndividualProperties
IndividualProperties defines two Property types: Accessibility and Age_Bin. The supporting software for Accessibility is the same as for the property types, Risk and Place, that were used in the previous tutorials. However, the Age_Bin property uses data from the demographics files for initial age distribution, and the membership in an Age_Bin group is updated as an individual ages. Therefore, the Age_Bin attribute has different structures than those of the other property types. For more information, see NodeProperties and IndividualProperties parameters.
Accessibility: Property and Values
Property and Values define two Accessibility groups: “Easy” and “Hard”. These two groups will be used to initialize the population with differential vaccination coverage. Individuals are randomly assigned one of these two values at birth and do not transition afterwards.
Accessibility: Initial_Distribution
At the beginning of the simulation, individuals have an equal chance of being assigned to either the “Easy” or “Hard” group as specified in the Initial_Distribution array.
Accessibility: Transitions
Individuals will not transition from one Accessibility group to the other therefore Transitions is empty.
Accessibility: TransmissionMatrix
TransmissionMatrix contains the  values for the WAIFW matrix that scales
the base infectivity. The transmission Route is “Contact”. The values are added to
Matrix.
values for the WAIFW matrix that scales
the base infectivity. The transmission Route is “Contact”. The values are added to
Matrix.
Matrix specifies the interaction between the “Easy” and “Hard” groups. Individuals in the “Easy” group are nine times as likely to be in contact with individuals of their own group. Similarly, individuals in the “Hard” accessibility group are five times as likely to interact with their own group.
The interpretation for this tutorial is that individuals in the “Hard” accessibility group have only 60% of the contacts of those in the “Easy” accessibility group. As an example, “Hard” accessibility could be caused by geographic isolation.
Age_Bin: Property and Age_Bin_Edges_In_Years
The second Property is Age_Bin. Instead of a Values array there is an Age_Bin_Edges_In_Years array that specifies the upper bounds of the age groups.
All of the middle values in the Age_Bins_In_Years array specify the upper bound of Age_Bin group that is neither the last nor the first group. This scenario has the following age groups:
- Birth to age 6
- Older than 6 to age 10
- Older than 10 to age 20
- Older than 20
Age_Bin: Initial_Distribution
The Age_Bin property does not support Initial_Distribution. As an age-dependent property, the distribution of the individuals in age bins is determined by the demographics file.
Age_Bin: Transitions
The Age_Bin property does not use Transitions in IndividualProperties. As an age-dependent property, the membership in an Age_Bin group is updated for individuals as they age. Transitions must be added to the IndividualProperties but it should be empty.
Age_Bin: TransmissionMatrix
TransmissionMatrix contains the values that scale the base infectivity. The transmission Route
is “Contact”. The values are added to Matrix.
The assumption for this scenario is that individuals interact more frequently with their own age group, and those groups closer in age. Therefore, Matrix has higher values on the diagonal entries.
IndividualProperties for Accessibility and Age_Bin
{
    "Defaults": {
        "IndividualProperties": [{
            "Property": "Accessibility",
            "Values": ["Easy", "Hard"],
            "Initial_Distribution": [0.5, 0.5],
            "Transitions": [],
            "TransmissionMatrix": {
                "Route": "Contact",
                "Matrix": [
                    [0.9, 0.1],
                    [0.1, 0.5]
                ]
            }
        }, {
            "Property": "Age_Bin",
            "Age_Bin_Edges_In_Years": [0, 6, 10, 20, -1],
            "Transitions": [],
            "TransmissionMatrix": {
                "Route": "Contact",
                "Matrix": [
                    [0.4, 0.2, 0.1, 0.3],
                    [0.2, 0.4, 0.1, 0.3],
                    [0.1, 0.2, 0.6, 0.1],
                    [0.1, 0.1, 0.1, 0.7]
                ]
            }
        }]
    }
}
Key configuration parameters
The following sections describe the parameters that define measles pathogenesis and immunity of an individual for all scenarios in this tutorial. Each scenario has a directory (A_BaselineOutbreak, B_AgeTargetedVaccine and C_AccessTargetedVaccine) that contains a simulation configuration files (config.json) file. The three directories are located in ScenariosHINT03_AgeAndAccess. The configuration files are the same in each directory but are copied in each directory to make it more convenient to run simulations.
Population dynamics parameters
The following parameters disable vital dynamics and disease mortality in the simulations. HINT is enabled. For more information, see Population dynamics parameters.
Set the following parameters:
- Set Enable_Vital_Dynamics to 0.
- Set Death_Rate_Dependence to “NONDISEASE_MORTALITY_BY_AGE_AND_GENDER”.
- Set Enable_Heterogeneous_Intranode_Transmission to 1.
Pathogenesis and immunity parameters
Measles is a highly infectious virus that is typically transmitted by large respiratory and aerosolized droplets. Some transmission also occurs via fomites, however this is believed to be a less significant route for transmission as the virus only survives a short time on dry surfaces. The pathogen is characterized by a high basic reproductive number, often estimated at 16-20 combined with short incubation and infectious periods on the order of days. Immunity conferred is typically lifelong and vaccination has high efficacy (~95%). For more information, see Immunity, Incubation, and Infectivity and transmission parameters.
The following parameters define measles pathogenesis and immunity of an individual.
Set the following parameters:
- Set Enable_Immunity to 1.
- Set Enable_Immune_Decay to 0.
- Set Base_Infectivity to 4.
- Set Base_Incubation_Period to 5.
- Set Base_Infectious_Period to 5.
- Set Incubation_Period_Distribution to “FIXED_DURATION.”
- Set Infectious_Period_Distribution to “EXPONENTIAL_DURATION.”
Interventions
Run the simulation and generate graphs of the simulation output for each of the following three scenarios. For more information, see Run simulations.
Note
Because the EMOD model is stochastic, your graphs may appear slightly different from those given below.
A: Baseline outbreak
The simulation seeds an initial measles outbreak with a prevalence of 1% in the age group of 10 to 20 years old who are in the “Easy” accessibility group.
Age groups do not use the PropertyRestrictions parameter. It uses the Target_Demographic parameter with the value set to “ExplicitAgeRanges”, which will use the values in Target_Age_Min and Target_Age_Max. For more information, see event coordinator parameters.
The campaign file (campaign.json) is in the ScenariosHINT03_AgeAndAccessA_BaselineOutbreak directory.
{
    "Use_Defaults": 1,
    "Events": [{
        "Start_Day": 2,
        "Nodeset_Config": {
            "class": "NodeSetAll"
        },
        "Event_Coordinator_Config": {
            "Demographic_Coverage": 0.01,
            "Intervention_Config": {
                "Antigen": 0,
                "Genome": 0,
                "outbreak_source": "PrevalenceIncrease",
                "class": "OutbreakIndividual"
            },
            "Target_Demographic": "ExplicitAgeRanges",
            "Target_Age_Min": 10,
            "Target_Age_Max": 20,
            "Property_Restrictions": ["Accessibility:Easy"],
            "class": "StandardInterventionDistributionEventCoordinator"
        },
        "class": "CampaignEvent"
    }]
}
Expected simulation output
In the fixed population of 1000 susceptible individuals, a total of 700 individuals become infected with a peak prevalence of 14% roughly 100 days into the epidemic. The number of individuals in the “Easy” and “Hard” groups is equal for each age group as specified in the initial distribution. Looking at the number of infected individuals by age and accessibility groups, notice that the numbers are significantly higher (peak prevalence) in the “Easy” accessibility group compared to “Hard”. This is due to the decreased transmission rate specified in the accessibility group matrix.
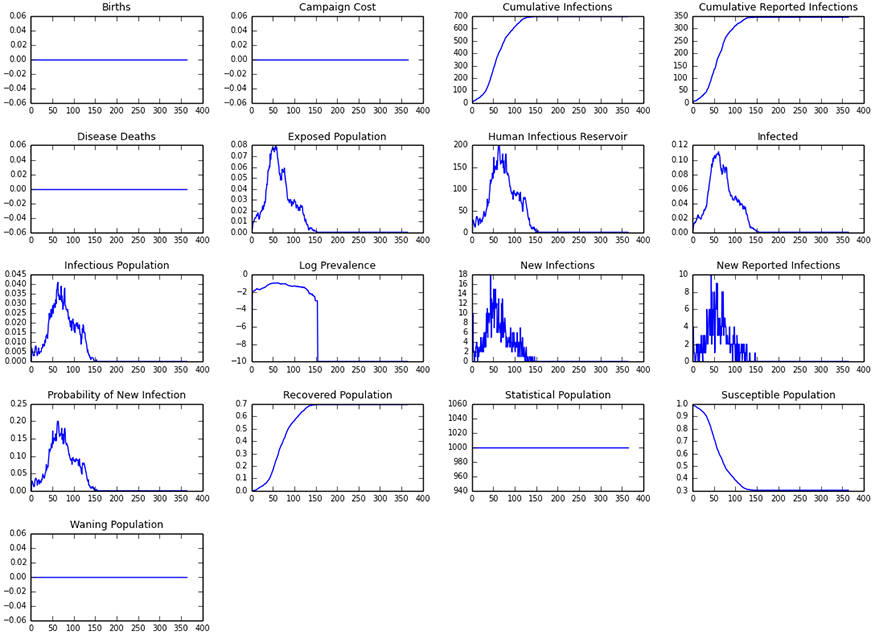
Figure 1: Baseline outbreak
B: Age-targeted outreach vaccination campaign
This simulation adds an age targeted vaccination on day 1 followed by the same outbreak seeding specified in the first scenario on day 2. The campaign configuration file (campaign.json) is in the ScenariosHINT03_AgeAndAccessB_AgeTargetedVaccine directory. For more information, see SimpleVaccine parameters.
{
    "Use_Defaults": 1,
    "Events": [
        {
            "Event_Coordinator_Config": {
                "Demographic_Coverage": 0.95,
                "Intervention_Config": {
                    "Cost_To_Consumer": 10.0,
                    "Durability_Time_Profile": "BOXDURABILITY",
                    "Primary_Decay_Time_Constant": 3650,
                    "Reduced_Acquire": 1,
                    "Reduced_Transmit": 0,
                    "Vaccine_Take": 0.95,
                    "Vaccine_Type": "AcquisitionBlocking",
                    "class": "SimpleVaccine"
                },
                "Target_Demographic": "ExplicitAgeRanges",
                "Target_Age_Min": 6,
                "Target_Age_Max": 10,
                "class": "StandardInterventionDistributionEventCoordinator"
            },
            "Nodeset_Config": {
                "class": "NodeSetAll"
            },
            "Start_Day": 1,
            "class": "CampaignEvent"
        }
    ]
}
Expected simulation output
Compare the number of infected-by-age in this simulation with the baseline outbreak scenario. Notice the dramatic decrease (an order of magnitude) of the infection in 6 to 10 year olds due to the vaccination of this group. Compare infections in other ages, noting the overall decrease in infection across age groups despite the fact that only 6 to 10 year olds were vaccinated.
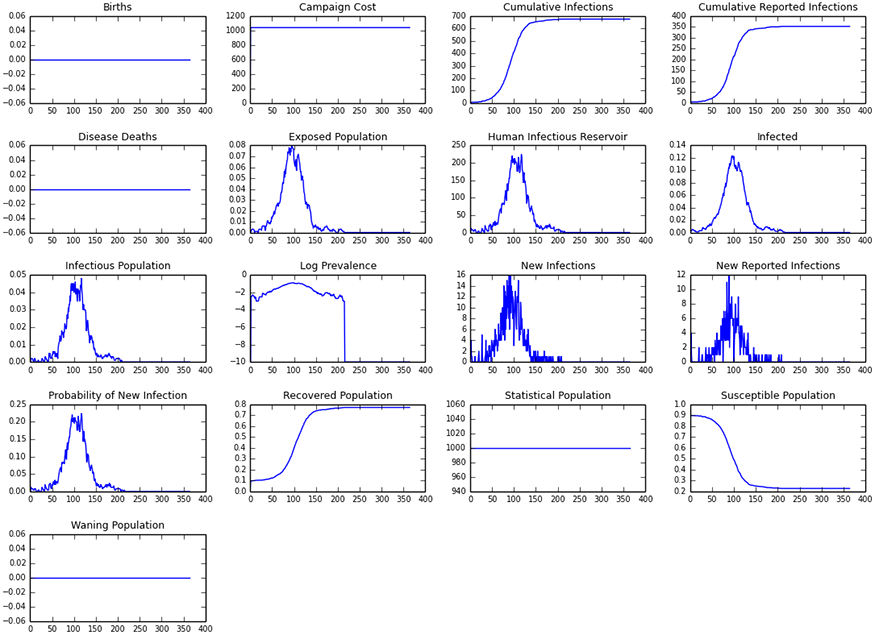
Figure 2: Age-targeted outreach vaccination campaign
C: Standard vaccination campaign
On day 1, a non-targeted vaccination campaign begins which reaches all those individuals in the “Easy” accessibility group but does not reach those in the “Hard” accessibility group.
This is followed by an outbreak that originates in the “Hard” accessibility group in the 0.5 to 6 year olds. In the first two scenarios, the outbreak originated in the “Easy” accessibility group among older children. This outbreak begins in the “Hard” accessibility group. For more information, see OutbreakIndividual and SimpleVaccine parameters.
The campaign configuration file (campaign.json) is in the ScenariosHINT03_AgeAndAccessC_AccessTargetedVaccine directory.
{
    "Use_Defaults": 1,
    "Events": [{
        "Start_Day": 2,
        "Nodeset_Config": {
            "class": "NodeSetAll"
        },
        "Event_Coordinator_Config": {
            "Number_Distributions": -1,
            "Intervention_Config": {
                "Antigen": 0,
                "Genome": 0,
                "outbreak_source": "PrevalenceIncrease",
                "class": "OutbreakIndividual"
            },
            "Demographic_Coverage": 0.01,
            "Target_Demographic": "ExplicitAgeRanges",
            "Target_Age_Min": 0.5,
            "Target_Age_Max": 6.0,
            "Property_Restrictions": ["Accessibility:Hard"],
            "class": "StandardInterventionDistributionEventCoordinator"
        },
        "class": "CampaignEvent"
    }, {
        "Event_Coordinator_Config": {
            "Demographic_Coverage": 0.95,
            "Intervention_Config": {
                "Cost_To_Consumer": 10.0,
                "Durability_Time_Profile": "BOXDURABILITY",
                "Primary_Decay_Time_Constant": 36500,
                "Reduced_Acquire": 1,
                "Reduced_Transmit": 1,
                "Vaccine_Take": 0.95,
                "Vaccine_Type": "AcquisitionBlocking",
                "class": "SimpleVaccine"
            },
            "Target_Demographic": "Everyone",
            "Property_Restrictions": ["Accessibility:Easy"],
            "class": "StandardInterventionDistributionEventCoordinator"
        },
        "Nodeset_Config": {
            "class": "NodeSetAll"
        },
        "Start_Day": 1,
        "class": "CampaignEvent"
    }]
}
Expected simulation output
Notice the dramatic decrease in cumulative incidence (~300 vs. ~700) and peak prevalence from the first scenario because of the vaccination campaign that targeted the “Easy” accessibility group.
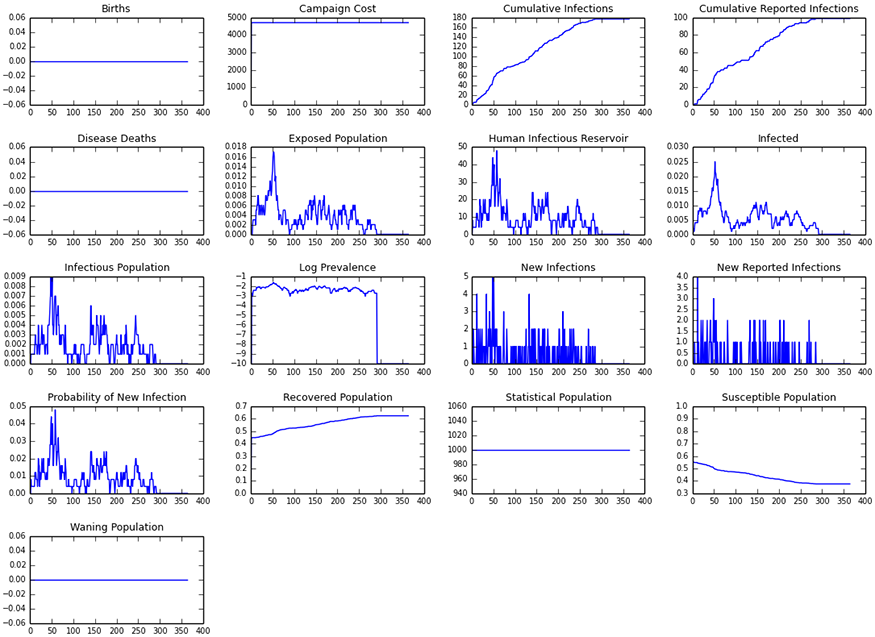
Figure 3: Easy accessibility targeted vaccine–Accessibility easy group
Notice the almost complete elimination of infection in the “Easy” accessibility group due to 95% vaccination coverage with a 95% take. There is only a slight reduction in infection in the “Hard” accessibility group which was not reachable by vaccination in this campaign. Recall that the epidemic was seeded in the “Hard” accessibility group.
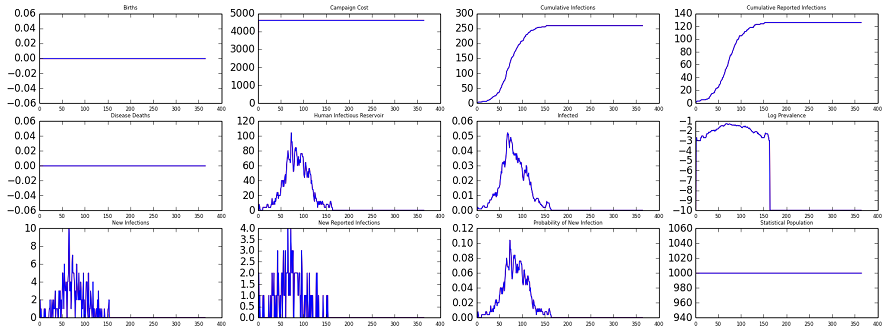
Figure 4: Easy accessibility targeted vaccine–Accessibility hard group
Exploring the model
Adjust both the targeted age and accessibility groups of the initial outbreak. In IndividualProperties, decrease the value of the off-diagonal entries in the TransmissionMatrix. Investigate how this slows down the spread of measles to the other age and accessibility groups in terms of both the speed of the disease spread and total incidence of the disease.
For one age and/or accessibility group, set all interactions with other groups to zero. To do this for the nth population group, set all values of the nth row to 0 except for the diagonal entry (nth column and nth row), which should remain unchanged.
Use the campaign cost output, which is proportional to the number of doses, to compare the cost- effectiveness of vaccination campaigns targeted at different age and accessibility groups. Also adjust coverage in different groups.
For example, the following Matrix values configure the interactions with other group for the third age group (older than 10 to 20 years).
{
    "Matrix": [
        [0.4, 0.2, 0.10, 0.3],
        [0.2, 0.4, 0.10, 0.3],
        [0.0, 0.0, 0.6, 0.0],
        [0.1, 0.1, 0.10, 0.7]
    ]
}
Verify that if the epidemic started in a different group, it cannot spread to this group.
How do results of the third scenario change if the infection is seeded in the “Easy” accessibility group? See that the infection fails to spread to the “Hard” accessibility group. Lower the vaccination coverage of the “Easy” accessibility group to find the vaccination level where the spread to the “Hard” accessibility group occurs.