HINT 4: Washington state pertussis
The Washington state pertussis tutorial highlights several important features of the 2012 pertussis outbreak in Washington state. These features include the timing and spatial pattern of the spreading outbreak, the relationship between vaccine-derived immunity levels in different population groups and disease incidence over the course of the outbreak, and the effects of within-age-group mixing and the switch from whole-cell to acellular vaccines on incidence in different age groups.
The Washington state pertussis tutorial consists of two scenarios:
- The baseline outbreak scenario initializes the historical vaccination of vaccine-accepting individuals before introducing a pertussis outbreak in Skagit county and letting it spread throughout the state. The supporting configuration and campaign files are in ScenariosHINT04_WAPertussisA_BaselineOutbreak.
- The target vaccine refusers scenario uses the baseline outbreak setup with the addition of a targeted vaccination before the outbreak of the previously vaccine-refusing populations in Snohomish, King, and Pierce counties. The supporting configuration and campaign files are in ScenariosHINT04_WAPertussisB_TargetVaccineRefusers.
This tutorial assumes that you have read the previous HINT tutorial, HINT 3: Age and accessibility.
Contents
Demographics inputs
You can see the complete hint_wapertussis_demographics file at <path_to_directory>RegressionScenariosInputFiles where <path_to_directory> is the location where EMOD source files were installed. For more information, see Demographics parameters.
Geography and population
Each of Washington state counties is specified as a geographical node with population estimates by county from 2013 WA State Office of Financial Management and geographic location (latitude and longitude) centered on county seats. The following code example is for the first county (node) listed in the demographics file.
{
    "Nodes": [{
        "County": "Adams",
        "NodeAttributes": {
            "Latitude": 47.1274,
            "InitialPopulation": 19200,
            "Longitude": -118.38
        },
        "NodeID": 1
    }]
}
IndividualAttributes
The initial age distribution is a uniform distribution of individuals between the ages of 0 and 60 years old. For more information, see IndividualAttributes parameters.
{
    "Defaults": {
        "NodeAttributes": {},
        "IndividualAttributes": {
            "AgeDistribution_DESCRIPTION": "Box between age 0 and 60 years: Age_Initialization_Distribution_Type=DISTRIBUTION_SIMPLE",
            "AgeDistributionFlag": 1,
            "AgeDistribution1": 0,
            "AgeDistribution2": 21900
        }
    }
}
Age-specific mortality is taken from Washington statewide numbers from CDC 1999-2010 in annual deaths per 1000 individuals.
{
    "Defaults": {
        "NodeAttributes": {},
        "IndividualAttributes": {
            "MortalityDistribution_DESCRIPTION": "WA state (1999-2010).  Source: wonder.cdc.gov",
            "MortalityDistribution": {
                "NumDistributionAxes": 2,
                "AxisNames": ["gender", "age"],
                "AxisUnits": ["male=0,female=1", "years"],
                "AxisScaleFactors": [1, 365],
                "NumPopulationGroups": [2, 15],
                "PopulationGroups": [
                    [0, 1],
                    [0, 1, 2.5, 7.5, 12.5, 17.5, 22.5, 30, 40, 50, 60, 70, 80, 90, 120]
                ],
                "ResultUnits": "annual deaths per 1000 individuals",
                "ResultScaleFactor": 0.00000273972602739726027397260273973,
                "ResultValues": [
                    [4.8, 0.2, 0.1, 0.2, 0.5, 1.1, 1.1, 1.7, 4.1, 9.2, 19.8, 53.7, 154.2, 1000],
                    [4.2, 0.2, 0.2, 0.2, 0.2, 0.4, 0.5, 1.1, 2.6, 5.5, 14.3, 40.1, 129.3, 1000]
                ]
            }
        }
    }
}
The birth rate used in the simulation is the value corresponding to stable population replacement.
{
    "Defaults": {
        "NodeAttributes": {
            "BirthRate_DESCRIPTION": "Replacement of stable age distribution: Birth_Rate_Dependence=DEMOGRAPHIC_DEP_RATE (i.e. 14-45 year-old PossibleMothers)",
            "BirthRate": 0.00017675
        },
        "IndividualAttributes": {}
    }
}
IndividualProperties
In this simulation IndividualProperties defines two Property types: Accessibility and Age_Bin. The IndividualProperties configuration is in the hint_wapertussis_demographics_overlay file. For more information, see NodeProperties and IndividualProperties parameters.
Accessibility: Property and Values
The Property and Values parameters define two Accessibility groups: VaccineTake and VaccineRefuse. Accessibility will be used to initialize the population with differential vaccination coverage. Individuals are randomly assigned one of these two values at birth and do not transition afterwards.
{
    "Defaults": {
        "IndividualProperties": [{
            "Property": "Accessibility",
            "Values": ["VaccineTake", "VaccineRefuse"],
            "Initial_Distribution": [0.85, 0.15],
            "Transitions": []
        }]
    }
}
Accessibility: Initial_Distribution
At the beginning of the simulation, individuals have an 85% chance of being assigned to VaccineTake and a 15% chance to VaccineRefuse as specified by the Initial_Distribution array.
Accessibility: Transitions
In this simulation, individuals will not transition from one Accessibility group to the other therefore the Transitions structure is empty.
Accessibility: TransmissionMatrix
The specification of enhanced within-group interaction is specified by the WAIFW matrix between the two groups: VaccineTake and VaccineRefuse. For example, a VaccineRefuse-type individual is 5 times more likely (compared to homogeneous mixing) to be exposed to infections from another individual within their group and 0.3 times as likely to be exposed to an individual outside their group.
The transmission Route is “Contact”. The  values of the WAIFW matrix for the heterogeneous mixing
between the Accessibility groups is defined in Matrix.
values of the WAIFW matrix for the heterogeneous mixing
between the Accessibility groups is defined in Matrix.
{
    "Defaults": {
        "IndividualProperties": [{
            "TransmissionMatrix": {
                "Route": "Contact",
                "Matrix": [
                    [1.1, 0.3],
                    [0.3, 5.0]
                ]
            }
        }]
    }
}
Age_Bin: Property and Age_Bin_Edges_In_Years
The second Property is Age_Bin. Three age bins are defined by the Age_Bins_In_Years array with heterogeneous mixing defined by the following TransmissionMatrix.
- The beginning 0 and ending -1 are mandatory elements in the Age_Bins_In_Years array.
- The 0 is the lower bound for the first Age_Bin group and specifies birth.
- The -1 is the upper bound of the last Age_Bin group and specifies the maximum age of the simulation.
All of the middle values in the Age_Bins_In_Years array specify the upper bound of Age_Bin group that is neither the last nor the first group. This simulation has the following age groups:
- Birth to age 5
- Older than 5 to age 13
- Older than 13
{
    "Defaults": {
        "IndividualProperties": [{
            "Property": "Age_Bin",
            "Age_Bin_Edges_In_Years": [0, 5, 13, -1],
            "Transitions": []
        }]
    }
}
Age_Bin: Initial_Distribution
The Age_Bin Property type does not support Initial_Distribution. As an age-dependent property, the distribution of the individuals in age bins is determined by the demographics file.
Age_Bin: Transitions
The Age_Bin property does not use Transitions. As an age-dependent property, the membership in an Age_Bin group is updated for each individual as he or she ages. Transitions must be added to the IndividualProperties but it should be empty.
Age_Bin: TransmissionMatrix
TransmissionMatrix contains the values of the WAIFW matrix that scale the base infectivity. The
transmission Route is “Contact”. The heterogeneous mixing between the age groups is defined in
Matrix.
{
    "Defaults": {
        "IndividualProperties": [{
            "TransmissionMatrix": {
                "Route": "Contact",
                "Matrix": [
                    [1.4, 1.0, 1.0],
                    [1.0, 2.5, 0.7],
                    [1.0, 0.7, 1.0]
                ]
            }
        }]
    }
}
IndividualProperties for Accessibility and Age_Bin
{
    "Defaults": {
        "IndividualProperties": [{
            "Property": "Accessibility",
            "Values": ["VaccineTake", "VaccineRefuse"],
            "Initial_Distribution": [0.85, 0.15],
            "Transitions": [],
            "TransmissionMatrix": {
                "Route": "Contact",
                "Matrix": [
                    [1.1, 0.3],
                    [0.3, 5.0]
                ]
            }
        }, {
            "Property": "Age_Bin",
            "Age_Bin_Edges_In_Years": [0, 5, 13, -1],
            "Transitions": [],
            "TransmissionMatrix": {
                "Route": "Contact",
                "Matrix": [
                    [1.4, 1.0, 1.0],
                    [1.0, 2.5, 0.7],
                    [1.0, 0.7, 1.0]
                ]
            }
        }]
    }
}
For more information on IndividualProperties, see Heterogeneous Intra-Node Transmission (HINT).
Migration
The daily migration rates between the various counties are taken from daily commuter data and are packed into the binary file in hint_wapertussis_regional_migration.bin.
These rates are most likely a lower bound on actual migration, especially between more distant counties, as they consider only daily commutes and not other longer-range modes.
Key configuration parameters
Enable_Heterogeneous_Intranode_Transmission must be set to 1 to enable the TransmissionMatrix structure in IndividualProperties. For more information, see NodeProperties and IndividualProperties parameters.
Each scenario has a directory (A_BaselineOutbreak and B_TargetVaccineRefusers) that contains a configuration files (config.json) file. The two directories are located in ScenariosHINT04_WAPertussis. The configuration files are the same but are copied in each directory to make it more convenient to run simulations.
Pertussis disease parameters
The generic-disease-model parameters are configured to approximate the dynamics of pertussis. There is a 7-day fixed incubation period followed by an infectious period drawn from an exponential with a mean duration of 22 days. The product of the daily infectiousness (0.6) and the mean infectious duration corresponds to an R0 of about 14. For more information, see Infectivity and transmission and Incubation parameters.
Set the following parameters:
- Set Base_Infectivity to 0.6.
- Set Base_Infectious_Period to 22.
- Set Base_Incubation_Period to 7.
- Set Incubation_Period_Distribution to “FIXED_DURATION.”
- Set Infectious_Period_Distribution to “EXPONENTIAL_DURATION.”
Upon clearing natural pertussis infections, individuals are configured to have complete protection against re-acquisition for a duration of 4 years. After 4 years, the protection wanes exponentially with a time constant of 16 years. The reduced transmission potential of immune individuals is configured to follow a similar waning pattern. For more information, see Immunity parameters.
Set the following parameters:
- Set Immunity_Acquisition_Factor to 0.
- Set Acquisition_Blocking_Immunity_Duration_Before_Decay to 1460.
- Set Acquisition_Blocking_Immunity_Decay_Rate to 0.00017.
Adapted population sampling
The simulation is configured to use adapted sampling rates in the various nodes as a function of population size. This improves the computing time of the simulation while minimizing the effect of over-sampling, (i.e. a compromised representation of the small-number stochastic effects). The maximum number of sampled individuals in any given node is configured to be 1000. For example, a county with 2 million individuals would have 1000 samples each with weight=2000, while a county with 10,000 individuals would have 1000 samples each with weight=10. For more information, see Sampling parameters.
Set the following parameters:
- Set Individual_Sampling_Type to “ADAPTED_SAMPLING_BY_POPULATION_SIZE.”
- Set Max_Node_Population_Samples to 1000.
Migration
The regional migration between nodes has been configured in a commute-driven mode with all migration events consisting of single round-trips where the migrating individual draws a duration of his or her stay from an exponential with a mean of one day before returning with probability = 1 to the home node. Without regenerating the binary migration file, it is possible to scale all regional migration rates up and down with the x_Regional_Migration multiplicative parameter. For more information, see:ref:config-migration parameters.
Set the following parameters:
- Set Migration_Pattern to “SINGLE_ROUND_TRIPS.”
- Set Regional_Migration_Roundtrip_Duration to 1.
- Set Regional_Migration_Roundtrip_Probability to 1.
Interventions
You can see the complete campaign.json in ScenariosHINT04_WAPertussis.
Initialization of population immunity
A ten-year burn-in allows for the age-structure of the vaccination schedule (including waning) to be initialized. Four vaccine-distribution events are specified in the campaign file, each targeted only at individuals with the “VaccineTake” value for the “Accessibility” property in the demographics file. For more information, see SimpleVaccine.
A vaccination calendar to all children under 12 years old, so that the rest of their childhood vaccinations are distributed as they age: 2 month, 4 month, 6 month, 17 month, 5 year, 11.5 year with 90% coverage at the fourth dose and 95% on each of the last two doses.
{
    "Calendar": [{
        "Age": 60,
        "Probability": 1
    }, {
        "Age": 120,
        "Probability": 1
    }, {
        "Age": 180,
        "Probability": 1
    }, {
        "Age": 510,
        "Probability": 0.9
    }, {
        "Age": 1825,
        "Probability": 0.95
    }, {
        "Age": 4200,
        "Probability": 0.95
    }],
    "Dropout": 0,
    "class": "IVCalendar"
}
A birth-triggered distribution of the same calendar to newborns as they are born throughout the simulation.
A health-seeking behavior for people over 12 years old to seek booster doses with a daily tendency (0.000548) corresponding to a 5-year mean waiting time.
A dose to over-12s at the beginning of the simulation to prime their immune systems to account for their historic childhood vaccination. The acellular pertussis vaccine is configured such that 95% of vaccinated individuals, for whom the vaccine takes, will have an initial 90% reduction in the probability of acquiring infection per exposure and a 60% reduction in their transmission potential if infected. The protection wanes exponentially (DECAYDURABILITY) with a time constant of approximately 7 years.
{
    "Cost_To_Consumer": 20.0,
    "Durability_Time_Profile": "DECAYDURABILITY",
    "Primary_Decay_Time_Constant": 2525,
    "Reduced_Acquire": 0.9,
    "Reduced_Transmit": 0.6,
    "Reduced_Mortality": 1,
    "Vaccine_Take": 0.95,
    "Vaccine_Type": "Generic",
    "class": "SimpleVaccine"
}
The initial immunity given to the over-12 population is intended to capture the slightly more immunogenic whole-cell vaccine, which is configured with 90% initial protection against both acquisition and transmission as well as a longer 20-year decay time.
Targeted outbreak
As a demonstration of the ability to target an outbreak at both a geographical region (or set of nodes) and at a target population (based on IndividualProperties), this simulation has two OutbreakIndividual interventions. The first (shown below) is distributed 10 years into the simulation and infects 1% of the “VaccineTake” population in the specified list of nodes (in this case only Skagit county with NodeID = 57). The other intervention, distributed 100 days later, infects 10% of the “VaccineRefuse” population in the same county.
{
    "Campaign_Name": "Washington State Pertussis Outbreak",
    "Event_Coordinator_Config": {
        "Intervention_Config": {
            "Antigen": 0,
            "Genome": 0,
            "Outbreak_Source": "PrevalenceIncrease",
            "class": "OutbreakIndividual"
        },
        "Demographic_Coverage": 0.01,
        "Number_Repetitions": 1,
        "Target_Demographic": "Everyone",
        "Property_Restrictions": ["Accessibility:VaccineTake"],
        "class": "StandardInterventionDistributionEventCoordinator"
    },
    "Nodeset_Config": {
        "Node_List": [57],
        "County_DESCRIPTION": "Skagit",
        "class": "NodeSetNodeList"
    },
    "Start_Day": 3650,
    "class": "CampaignEvent"
}
Run the simulation
Run the simulation and generate graphs of the simulation output. For more information, see Run simulations.
Note
Because the EMOD model is stochastic, your graphs may appear slightly different from those given below.
Spatial spread
The Plot_Infections_By_Node.py script unpacks the SpatialOutput binary files, which are written out for each channel listed in the configuration parameter, Spatial_Output_Channels, provided that Enable_Spatial_Output is set to 1. For more information, see Output settings parameters.
The following plot shows the daily incidence of new infections for a representative sampling of counties in the simulation. From top to bottom, one can see the characteristic evolution of each local outbreak, starting in Skagit county and progressing southward through Snohomish and King counties down to Clark county on the Oregon border. Similarly, there is a delay before the outbreak makes it over Cascades into the Tri-Cities (Benton and Franklin counties) and Spokane areas.
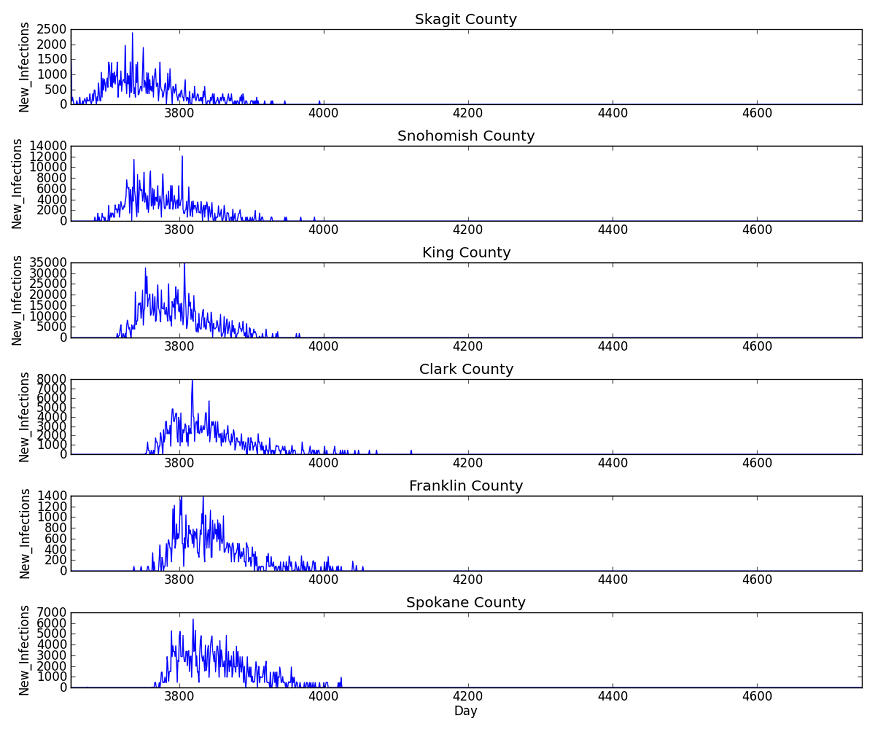
Figure 1: Daily incidence of new infections in representative sample of counties
Incidence in different groups
The Plot_Infections_by_Property.py script parses the output of the PropertyReport.json file (provided that Enable_Property_Output is set to 1) and plots the output channels grouped according to the property values specified within the script. In the following example, the total number of cases and the population-normalized incidence is compared between the “VaccineTake” and “VaccineRefuse” groups.
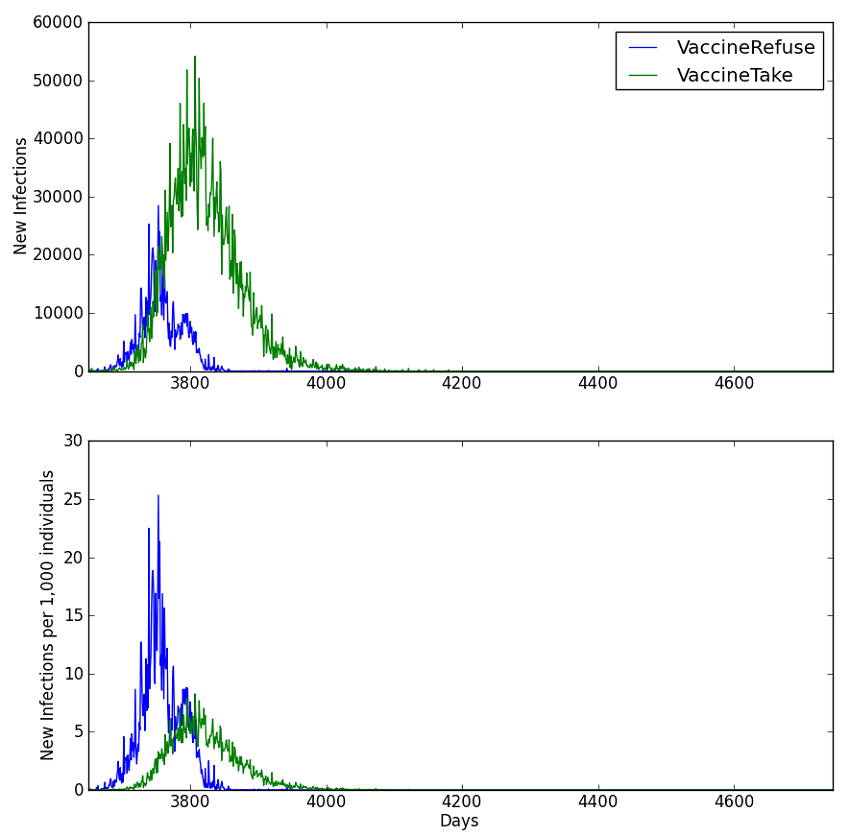
Figure 2: Population-normalized incidence of new infection by accessibility groups
Incidence by age
Finally, the Plot_Age_Distributions.py script parses the BinnedReport.json output (provided that Enable_Demographics_Reporting is set to 1) and plots the population in each age bin through time and also the cumulative incidence of infection in age bins as shown below.
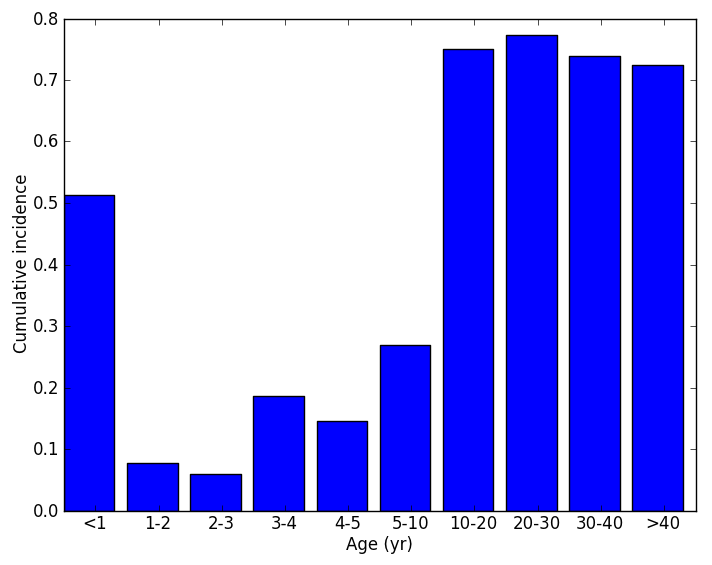
Figure 3: Population of age bins and cumulated incidence
Exploring the model
There are a number of different areas that one could explore within this tutorial:
- Modifying the vaccination coverage, efficacy, and waning values to see the impact on the size and make-up of the effected populations.
- Modifying the migration rates and county-level variation in vaccine-derived immunity to see the impact on the spatio-temporal pattern of the spreading outbreak.
- Modifying the heterogeneous mixing within age groups and the relative protective efficacy of the whole-cell and acellular vaccines to see the impact on the age distribution of the effected population.
- Introducing targeted interventions before the outbreak to minimize its impact.
As an example, the last category is provided in the directory ScenariosHINT04_WAPertussisB_TargetVaccineRefusers and consists of a targeted vaccination 100 days before the outbreak that reaches 95% of the previously unvaccinated VaccineRefuse population in the three most-populous counties: King, Snohomish and Pierce.
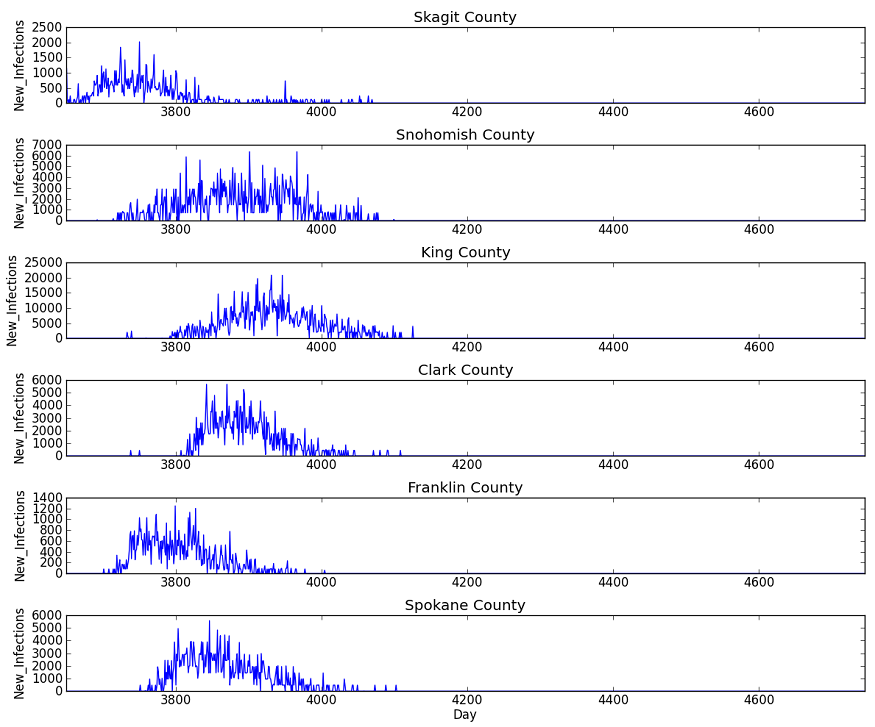
Figure 4: Impact of targeted vaccines in King, Snohomish and Pierce counties