HINT 5: Seattle commuting
This tutorial simulates the person-person disease transmission of influenza in Seattle over the course of one year. The tutorial assumes that individuals have round-trip travels, or commutes, between census tracts in less than one day. The return time is less than or equal to 8 hours and movement is in equilibrium. Different from homogeneous mixing, the heterogeneous movement links and rates between census tracts will create a timing difference of epidemic trajectories upon initial seeding.
The tutorial represents Seattle as a single node. There are 125 groups based on Seattle census tract
data. The heterogeneous infectivity between individuals and the 125 groups is represented by a WAIFW
matrix with  values. The values, which represent the heterogeneous force of
infection at each census tract, are based on the movement rate between census tracts and the return
rate. Individuals interact mostly with other individuals in their own census tract but also shed
into or acquire infection from the census tracts that they commuted to during the day.
values. The values, which represent the heterogeneous force of
infection at each census tract, are based on the movement rate between census tracts and the return
rate. Individuals interact mostly with other individuals in their own census tract but also shed
into or acquire infection from the census tracts that they commuted to during the day.
Contents
Demographics inputs
To view the complete demographics file, see hint_seattlecommuting_demographics at <path_to_directory>RegressionScenariosInputFiles where <path_to_directory> is the location where EMOD source files were installed. For more information, see Demographics parameters.
Generating Seattle as a single node
The hint_seattlecommuting_demographics file was generated from the multi-node Seattle_30arcsec_demographics file, the Seattle_30arcsec_local_migration file, and the Seattle_30arcsec_regional_migration file using the Python script ConvertMultipleNodeDemographicsToSingleNodePools. The script also added the IndividualProperties attribute that is needed for this tutorial.
The ConvertMultipleNodeDemographicsToSingleNodePools Python file, Seattle_Template, which is a copy of the hint_seattlecommuting_demographics file, and the three multi-node input files are in the ScenariosHINT05_SeattleCommutingscript directory.
IndividualProperties
For more information, see IndividualAttributes parameters.
Property and Values
The Property and Values parameters of IndividualProperties define 125 groups based on Seattle census tracts. The Property type must be “Geographic” as it is the only property that supports 125 Values. The Values are the 3-digit ID for the 125 Seattle census tracts for Seattle.
Initial_Distribution
Initial_Distribution is an array with 125 elements. See the hint_seattlecommuting_demographics file for those values.
Transitions
Individuals will not move from one Seattle census track to the other so Transitions is empty.
TransmissionMatrix
TransmissionMatrix contains the values that scale the base infectivity. The transmission Route
is “Contact”. The values are added to Matrix.
The Matrix was created using a script with a specified return rate. The script loads the existing multi-node demographics and migration input files, and converts them to a single-node demographics file. Each component in the TransmissionMatrix is calculated based on the spatial coupling of round- trip movement flow detailed in the article: Balcan, D., Colizza, V., Gonçalves, B., et al. (2009). Multiscale mobility networks and the spatial spreading of infectious diseases. PNAS 106(51), 21484-21489. doi: 10.1073/pnas.0906910106.
Since the average hours to stay at a destination is 8 hours (1/3 of a day) and the return rate is
the inverse of the average hours, the return rate is 3. That is,  .
.
There are 125 Seattle census tracts so the Matrix is a 125 x 125 matrix.
See the hint_seattlecommuting_demographics file in the ScenarioInputFiles directory to see the complete IndividualProperties for this simulation.
{
    "Defaults": {
        "IndividualProperties": [{
            "Property": "Geographic",
            "Values": ["001", "002", "003", "124", "125"],
            "Initial_Distribution": [125],
            "Transitions": [],
            "TransmissionMatrix": {
                "Route": "Contact",
                "Matrix": []
            }
        }]
    }
}
Key configuration parameters
The generic disease model parameters are configured to approximate the dynamics of influenza-like- illness disease. The key influenza disease parameters are listed below. For more information, see Infectivity and transmission and Incubation parameters.
You can see the complete config.json file in the ScenariosHINT05_SeattleCommuting directory.
Set the following parameters:
- Set Base_Infectivity to 0.3.
- Set Base_Infectious_Period to 7.
- Set Base_Incubation_Period to 3.
- Set Enable_Heterogeneous_Intranode_Transmission to 1.
- Set Incubation_Period_Distribution to “FIXED_DURATION.”
- Set Infectious_Period_Distribution to “FIXED_DURATION.”
Interventions
This simulation uses an OutbreakIndividual event to demonstrate the ability to target an outbreak at a geographical region represented as a heterogeneous group. The OutbreakIndividual targets the infection at 1% of the individuals living in census tract 7 at day 20. For more information, see OutbreakIndividual parameters.
You can see the complete campaign.json file in the in the ScenariosHINT05_SeattleCommuting directory.
{
    "Use_Defaults": 1,
    "Events": [{
        "Campaign_Name": "Generic Seattle Regression Campaign",
        "Event_Coordinator_Config": {
            "Coverage": 1,
            "Demographic_Coverage": 0.01,
            "Intervention_Config": {
                "Antigen": 0,
                "Event_Name": "Outbreak",
                "Genome": 0,
                "outbreak_source": "ImportCases",
                "class": "OutbreakIndividual"
            },
            "Number_Distributions": 1,
            "Number_Repetitions": 1,
            "Target_Age_Max": 100,
            "Target_Age_Min": 0,
            "Target_Demographic": "Everyone",
            "Property_Restrictions": ["Geographic:007"],
            "class": "StandardInterventionDistributionEventCoordinator"
        },
        "Nodeset_Config": {
            "class": "NodeSetAll"
        },
        "Start_Day": 20,
        "class": "CampaignEvent"
    }]
}
Run the simulation
Run the simulation and generate graphs of the simulation output. For more information, see Run simulations.
Note
Because the EMOD model is stochastic, your graphs may appear slightly different from those given below.
Expected simulation output
This tutorial shows the timing difference of disease spread between groups due to spatial coupling. It has 125 groups that represent the census tracts in Seattle and simulates a daily commute between the census tracts.
The following Inset Charts shows the daily number of infected people for each census tract in the simulation sorted by census tract ID. The census tracts are sequentially ordered with the census tract with the lowest number at the top of the graph. the graph shows the difference in timing between census tracts in terms of the disease spread.
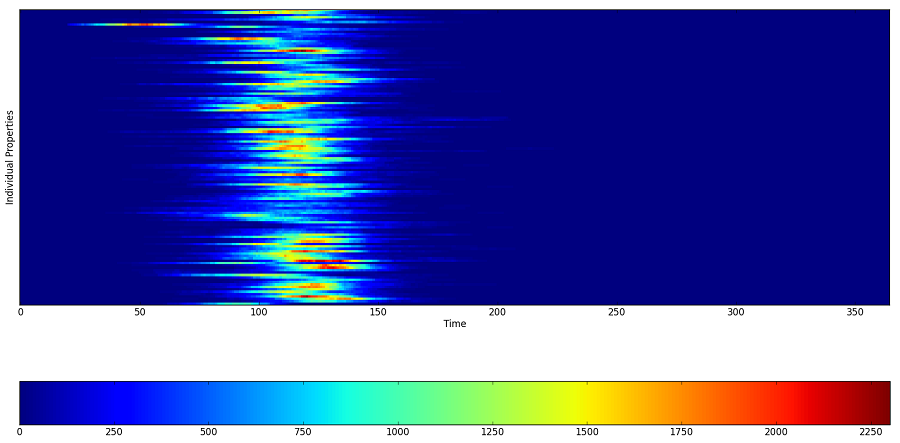
Figure 1: Number of infected people per census tract
Exploring the model
Change the return rates to either increase or decrease the spatial coupling when generating the demographic input and transmission matrix. In general, when the return rates are high, there is less coupling between census tracts so the disease curves of the outbreak are less synchronized. The following example shows a less synchronized behavior of disease spread when the return rate = 24 (people spend 1 hour on average at their destination) with the outbreak targeted at “Geographic: 7” in the demographics file.
Updating a demographics file
You can manually modify the the Seattle_template provided in the ScenariosHINT05_SeattleCommutingscript directory. However, because of the size of the TransmissionMatrix, you might want to use the Python scripts (also in ScenariosHINT05_SeattleCommutingscript) to modify the Seattle_template and regenerate the demographics file. Update the value of returnRate in ConvertMultipleNodeDemographicsToSingleNodePools using an editor of your choice.
Note
All of the multi-node demographics files and Seattle_template must be in the same directory.
For example, the following Inset Chart graph shows decreased spatial coupling after modifying the demographics file.
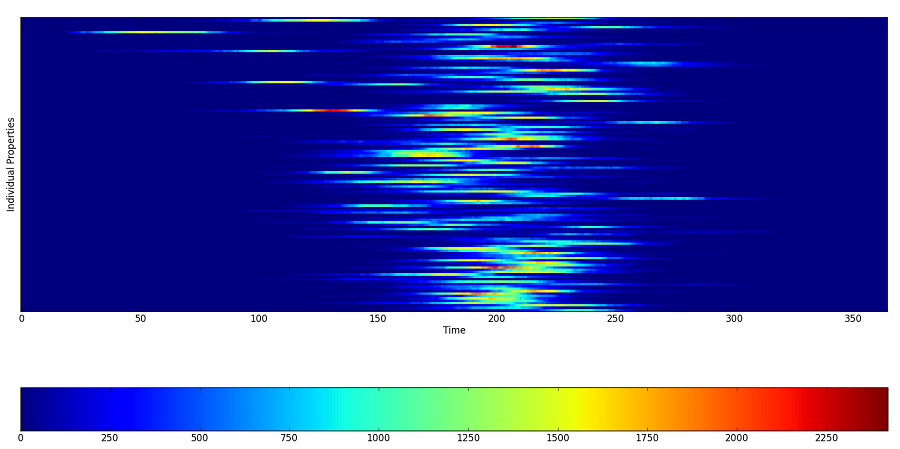
Figure 2: Decreased coupling between census tracts