Built-in graphics
Charles Eliot
2023-09-22
graphics.RmdIn this note we describe the graphing functions built into the pacehrh package.
First things first …
… creating some data.
library(pacehrh)

pacehrh::InitializePopulation()
pacehrh::InitializeScenarios()
pacehrh::InitializeStochasticParameters()
pacehrh::InitializeSeasonality()
pacehrh::InitializeCadreRoles()

scenario <- "MergedModel"

pacehrh::SetGlobalStartEndYears(2025, 2050)

results <-
  pacehrh::RunExperiments(scenarioName = scenario,
                       trials = 25)
Fertility and mortality rates
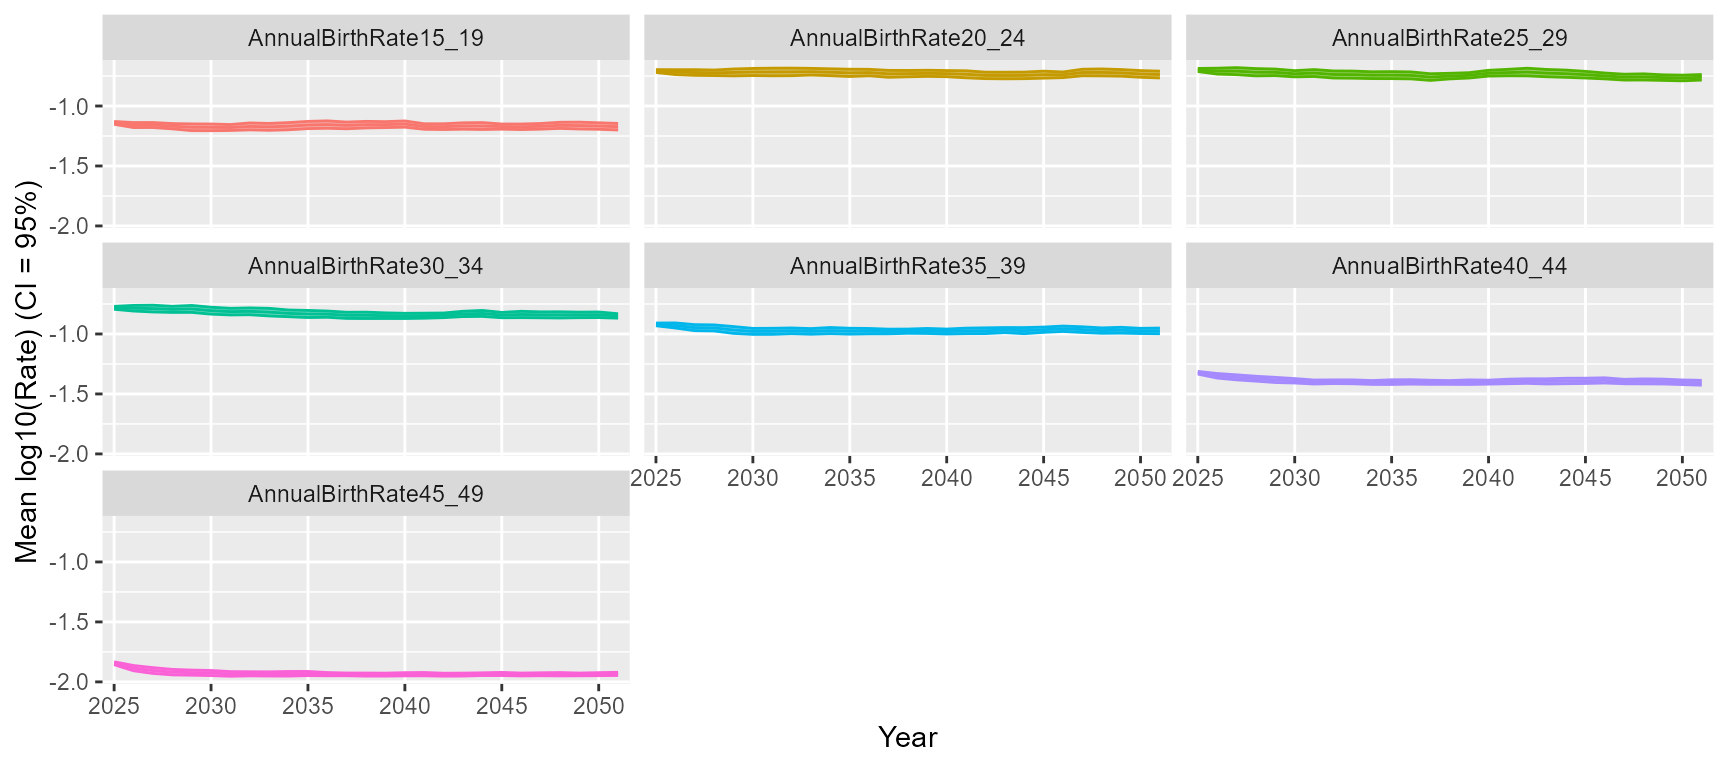
The function PlotFertilityRatesStats() creates graphs of
the fertility and mortality rates used to generate population
predictions.
- type : {“ribbon” | “lines” | “boxplot”}
-
se : {TRUE | FALSE} - doesn’t apply to
type = "boxplot"- FALSE : confidence interval display based on standard deviation
- TRUE : confidence interval display based on standard error
-
log : {TRUE | FALSE}
- FALSE : linear y-axis
- TRUE : logarithmic (log10) y-axis
g <- pacehrh::PlotFertilityRatesStats(results, type = "boxplot", log = FALSE)
print(g)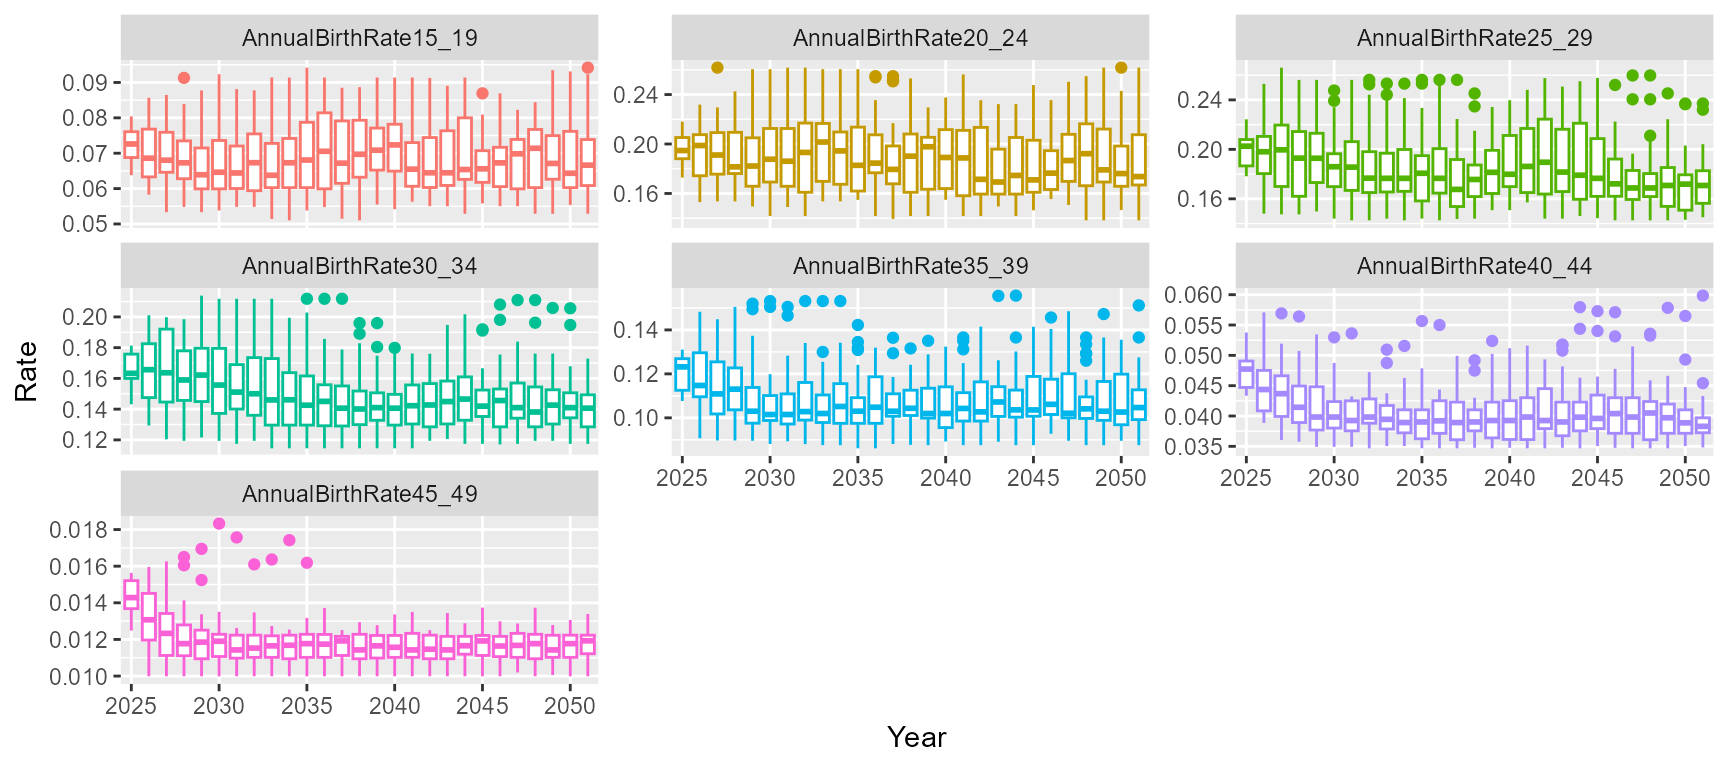
g <- pacehrh::PlotFertilityRatesStats(results, type = "boxplot", log = TRUE)
print(g)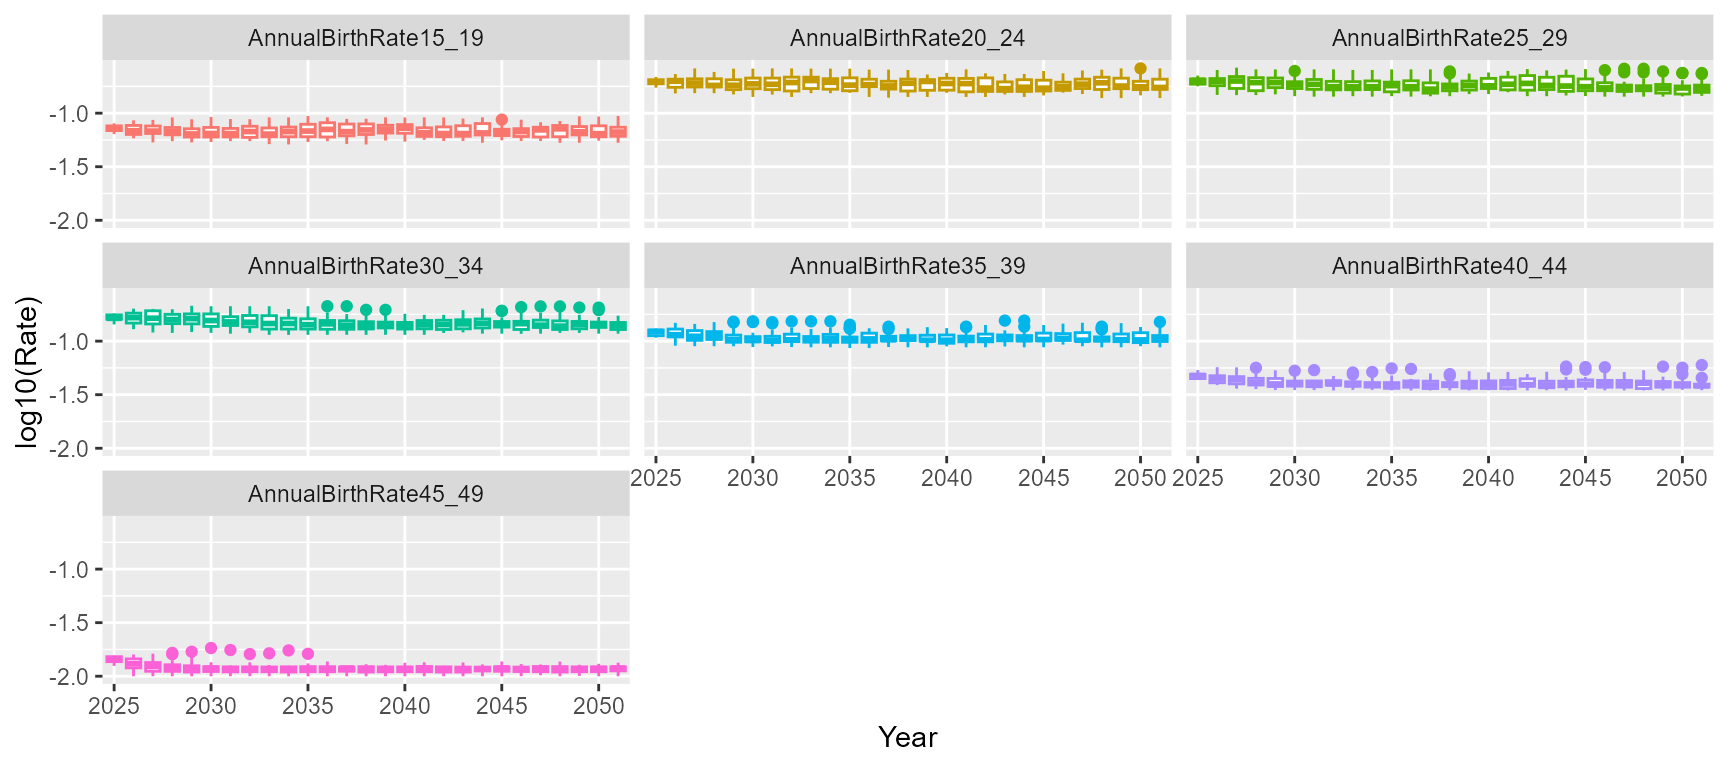
g <- pacehrh::PlotFertilityRatesStats(results, se = FALSE, type = "lines")
print(g)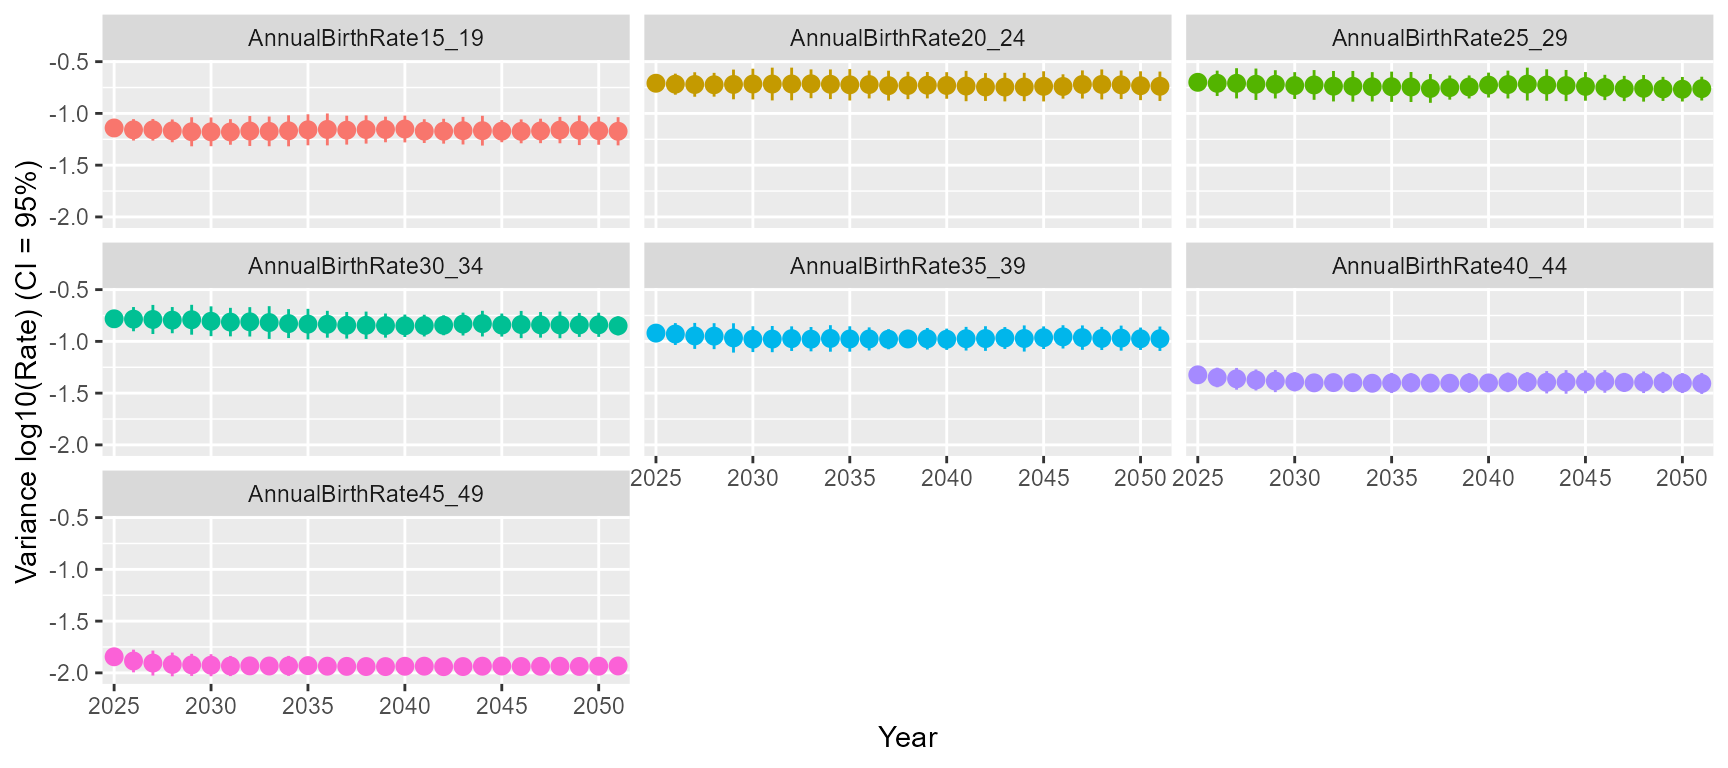
g <- pacehrh::PlotFertilityRatesStats(results, se = TRUE, type = "lines")
print(g)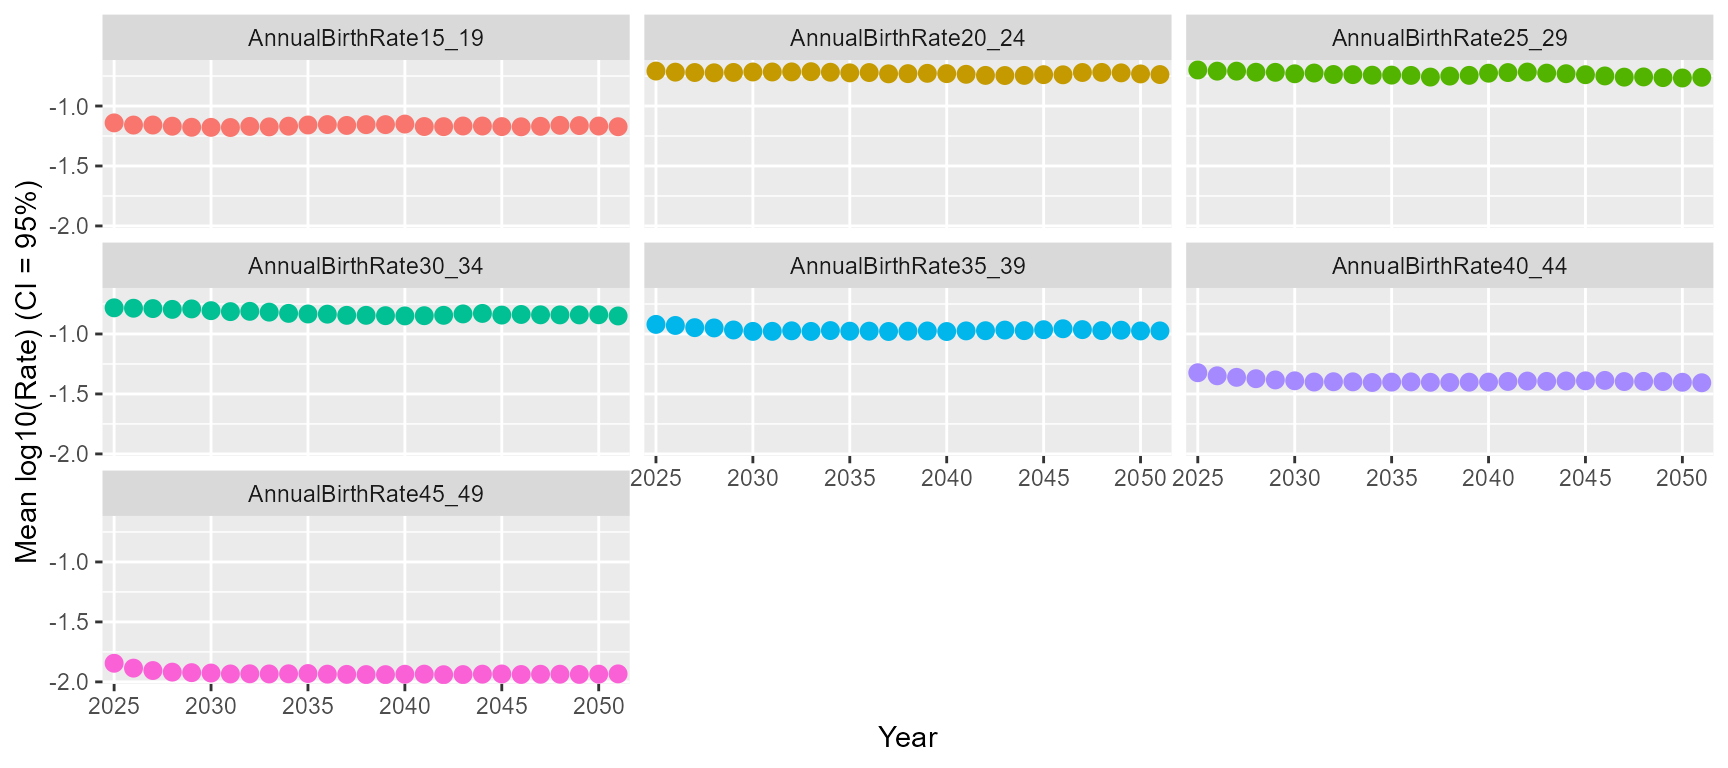
g <- pacehrh::PlotFertilityRatesStats(results, se = FALSE, type = "ribbon")
print(g)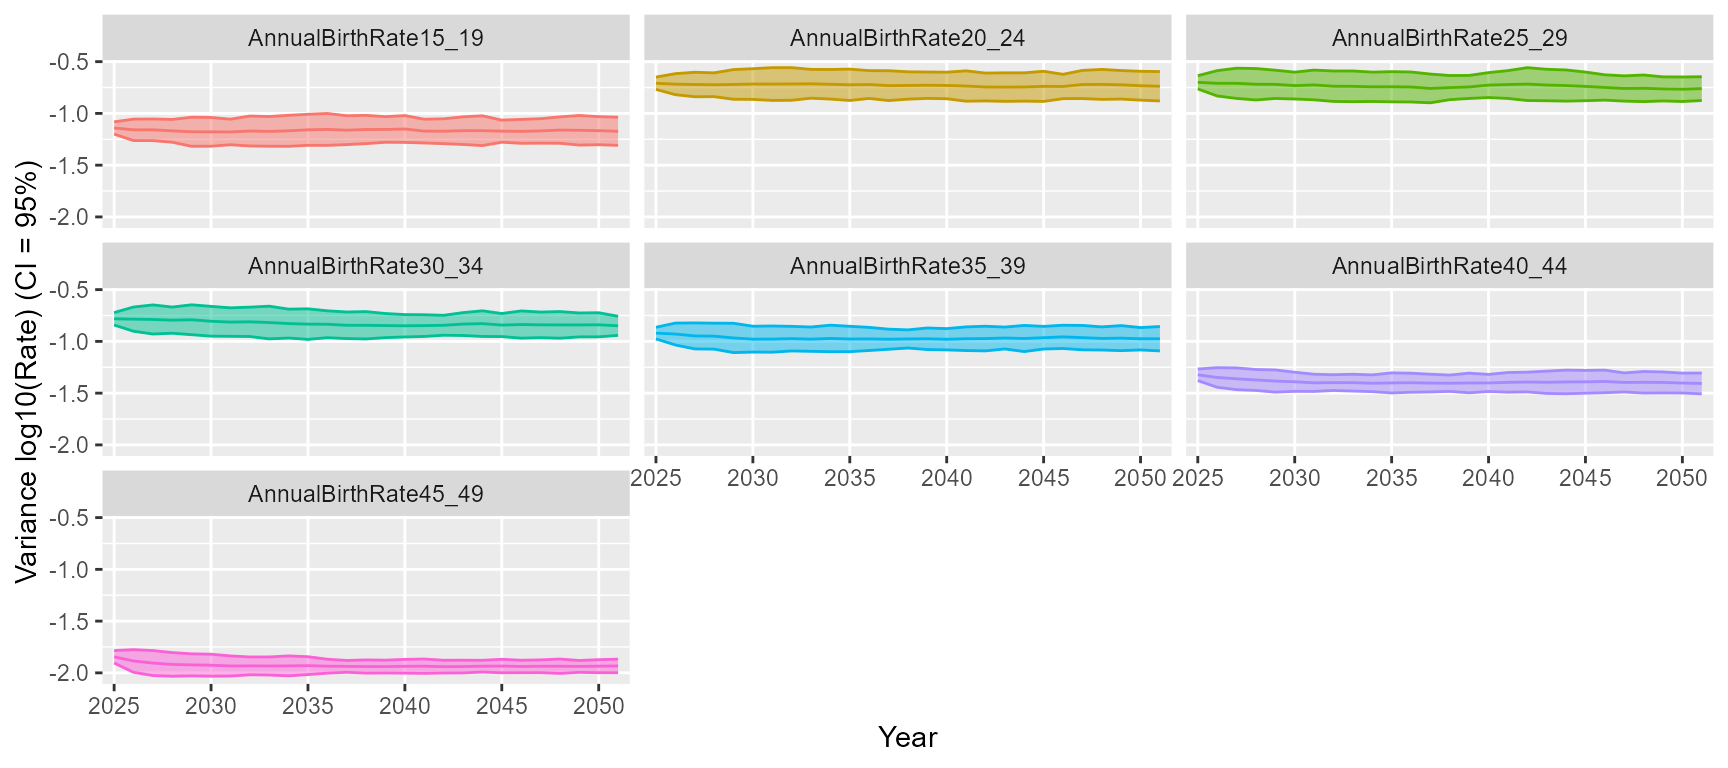
g <- pacehrh::PlotFertilityRatesStats(results, se = TRUE, type = "ribbon")
print(g)