Introduction to the software
The Institute for Disease Modeling (IDM) develops detailed simulations of disease transmission through the use of extensive and complex software modeling. The primary software, Epidemiological MODeling software (EMOD), helps determine the combination of health policies and intervention strategies that can lead to disease eradication. EMOD calculates how diseases may spread in particular areas and is used to analyze the effects of current and future health policies and intervention strategies. It supports infectious disease campaign planning, data gathering, new product development, and policy decisions. We share this modeling software with the research community to advance the understanding of disease dynamics.
EMOD supports the following simulation types for modeling a variety of diseases:
- Generic disease (GENERIC_SIM)
- Vector-borne diseases (VECTOR_SIM)
- Malaria (MALARIA_SIM)
- Tuberculosis (TB_SIM)
- Sexually transmitted infections (STI_SIM)
- HIV (HIV_SIM)
The illustration below shows how the simulation types are built upon one another. All parameters available in the generic simulation type are inherited by the vector simulation type. The vector simulation type adds additional parameters specific to the biology of vector-borne diseases, which in turn are inherited by the malaria simulation type and so on. Therefore, depending on the simulation type you select, different parameters are available for you to use. In addition, simulation types for broader classes of disease can be extended to build your own disease-specific model.
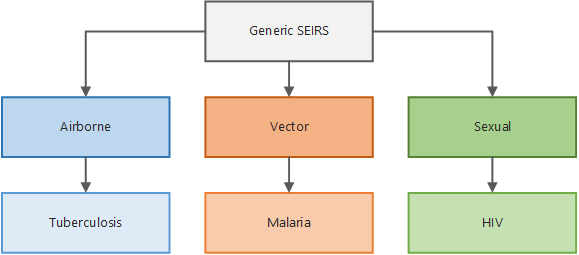
Simulation type inheritance
EMOD is a stochastic, agent-based model that simulates the actions and interactions of individuals within geographic areas known as nodes to understand the disease dynamics in a population over time. EMOD can produce statistically significant results over a broad set of parameters and scenarios. Quantitative analysis of the simulated output enables disease eradication efforts to make more data-driven decisions. The IDM research team has published many articles related to modeling, as well as the modeling concepts underpinning EMOD. For a list of published articles, see IDM Publications.
This section provides the conceptual overview of EMOD. The architecture diagram below shows, at a high level, how the system functions. If you run simulations in parallel on a multi-node cluster, there is also a Message Passing Interface (MPI) component used to pass data between multiple instances of EMOD.
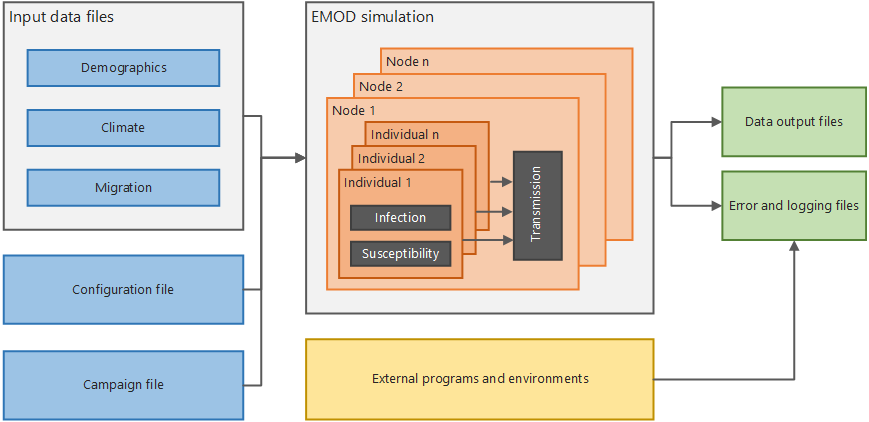
High-level EMOD system architecture
Input data files
Not all files accepted as input for running a simulation are considered input data files. Rather, input data files contain the relatively fixed information about a population to model. For example, climate, geography, demographics, and migration data.
Configuration file
The configuration file contains parameters that control many different aspects of the simulation. EMOD provides hundreds of parameters for you to configure your simulation. For example, configuration parameters can control the following:
- The disease or disease class to simulate (simulation type)
- The name and location for the input data files and output files
- Whether to include births, deaths, and migration
- Disease attributes, such as infectivity, transmission, immunity, and mortality
- The computing resources to use
Campaign file
The campaign file contains parameters that distribute outbreaks and the interventions used to control the spread of disease. For example, campaign parameters can control the following:
- Target demographic (age, location, gender, etc.) for interventions
- Diagnostic tests to use
- The cost and timing of interventions
Running a simulation
The EMOD executable (Eradication.exe) accepts the input data, configuration, and campaign files and then simulates the susceptibility and infection of individuals within each geographic node. The simulation type controls the transmission mechanism of the disease. After the simulation is complete, the Eradication.exe produces output reports that describe various aspects of the disease dynamics within the modeled population.
You can run simulations locally or on a multi-core cluster. Because the model is stochastic, you must run simulations multiple times to produce scientifically valid results.
Depending on how you run the simulation, other programs or environments external to EMOD may also output error and logging files.
Output files
After the simulation finishes, a reporter extracts simulation data, aggregates it, and outputs it to a file (known as an output report). Most of the reports are also JSON files, the most important of which is InsetChart.json. The InsetChart.json file provides simulation-wide averages of disease prevalence at each time step.
See the topics listed below for a more detailed explanation of each of these system components.